
Introducing TopLeft's New UI
We're excited to show off more of the new version of TopLeft! If you want to use this new UI in TopLeft, please email help@topleft.team to request access.
Some of the improvements in the new UI are most applicable to administrators and managers who set up boards, and other improvements are for everyone who uses boards and Gantt charts.
Improvements for Managing Boards/Views
We completely rebuilt how boards and Gantt charts are configured. The new way is easier and more flexible than the old way.
To take advantage of the new UI, you need to make a new view. Old boards still show up in the old UI. We will be introducing migration tools in February.
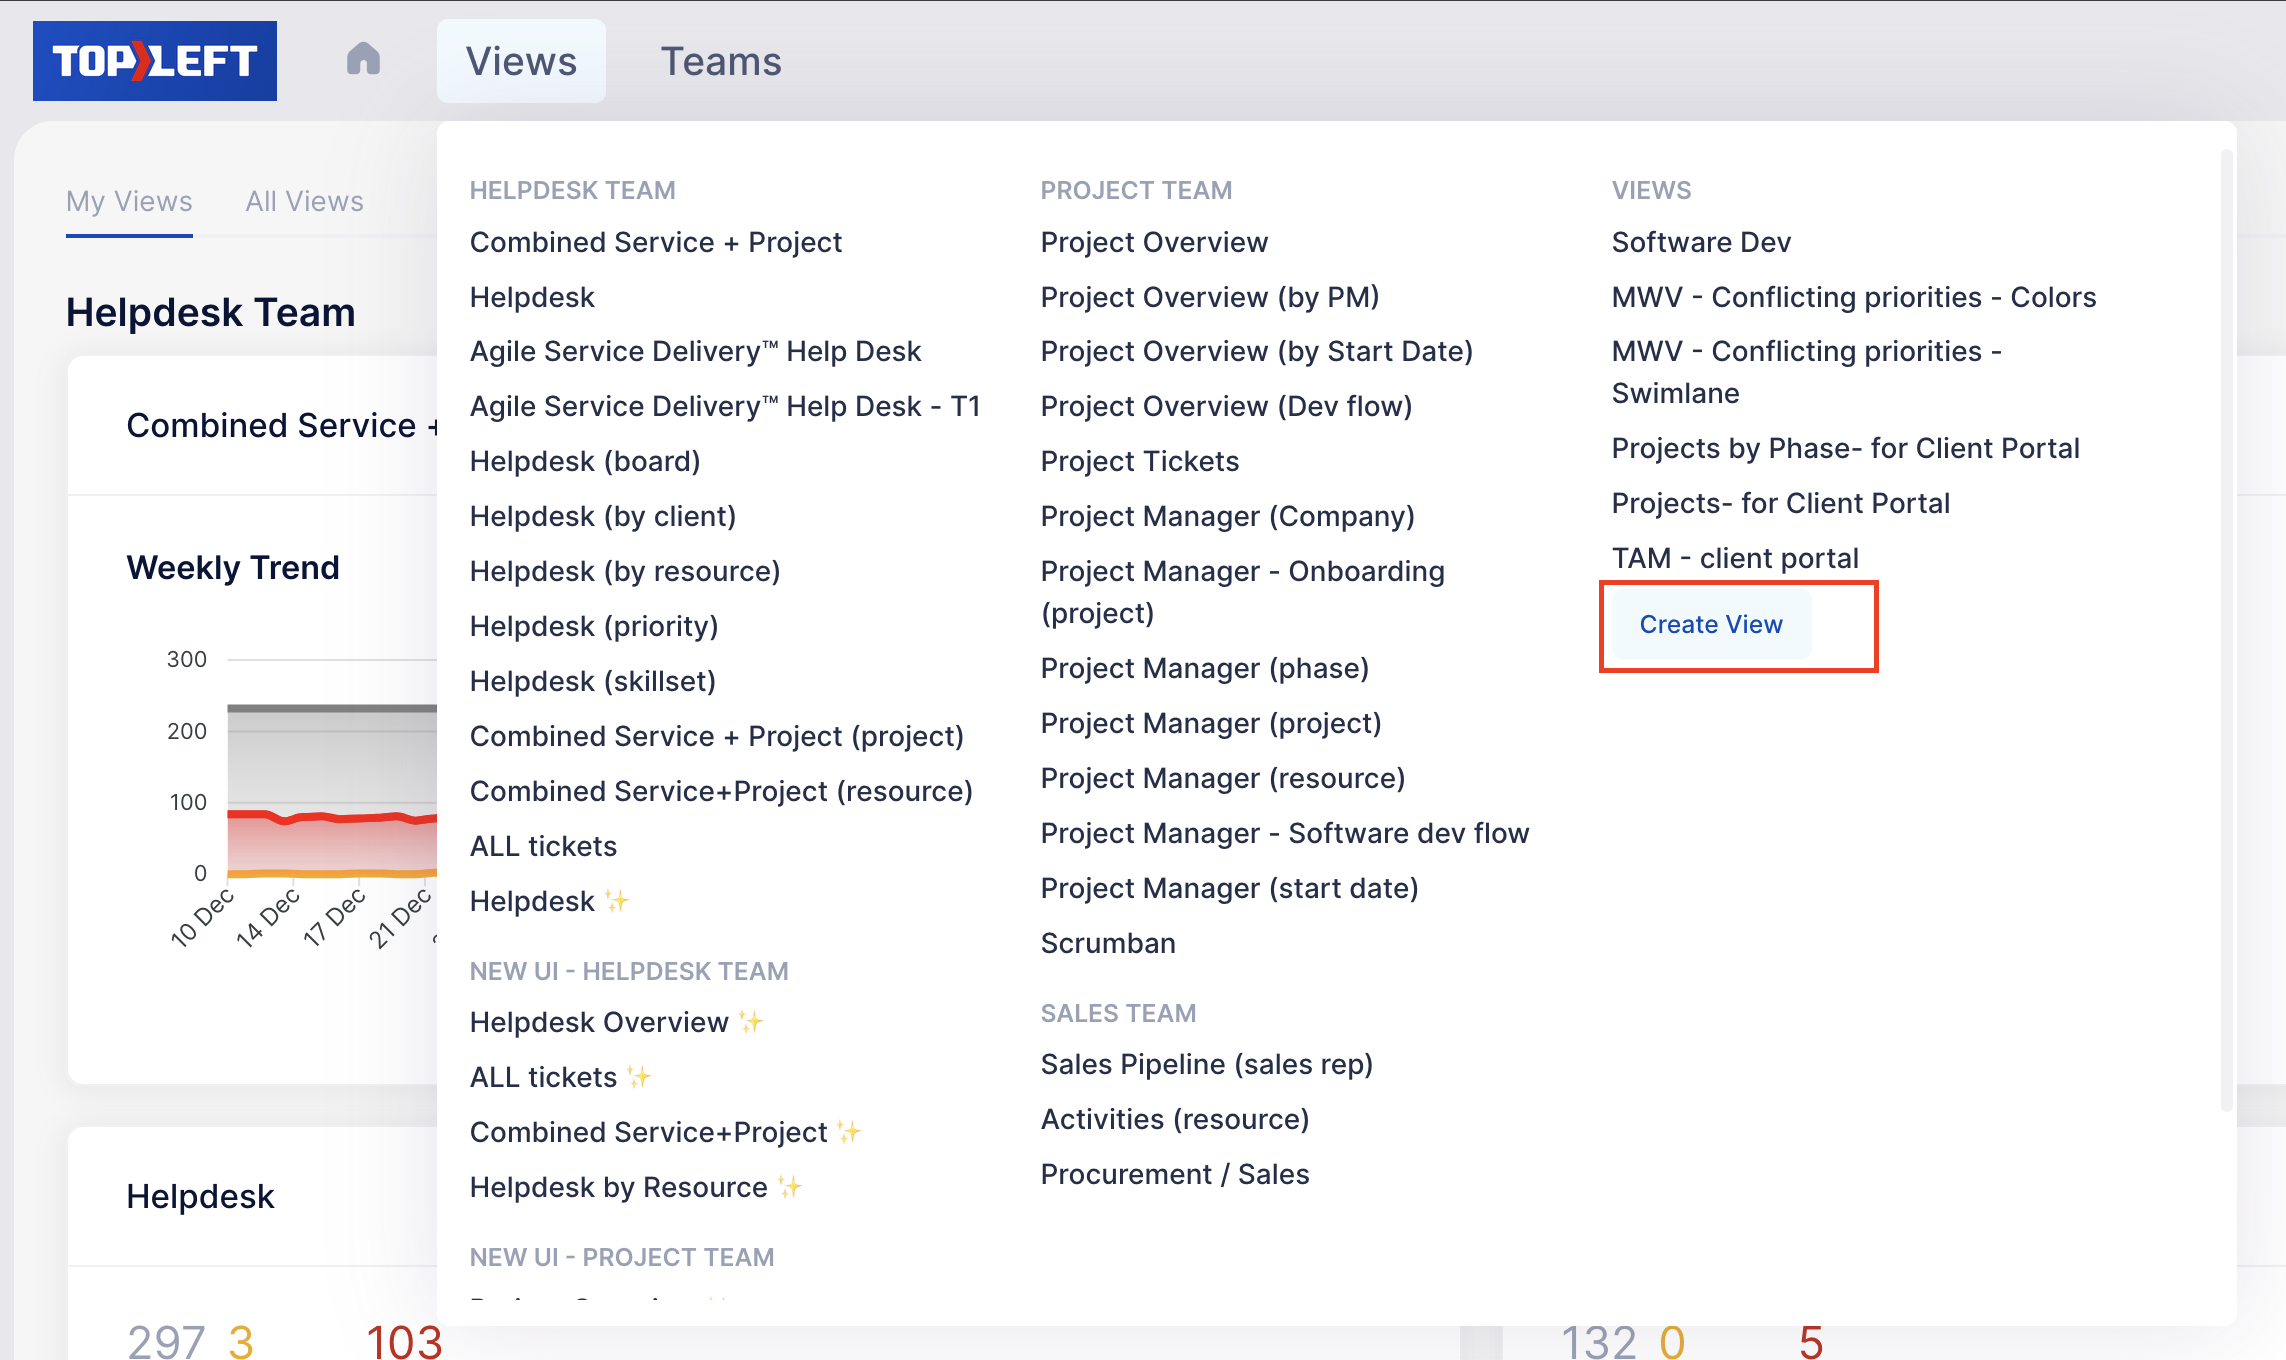
Flexible query builder
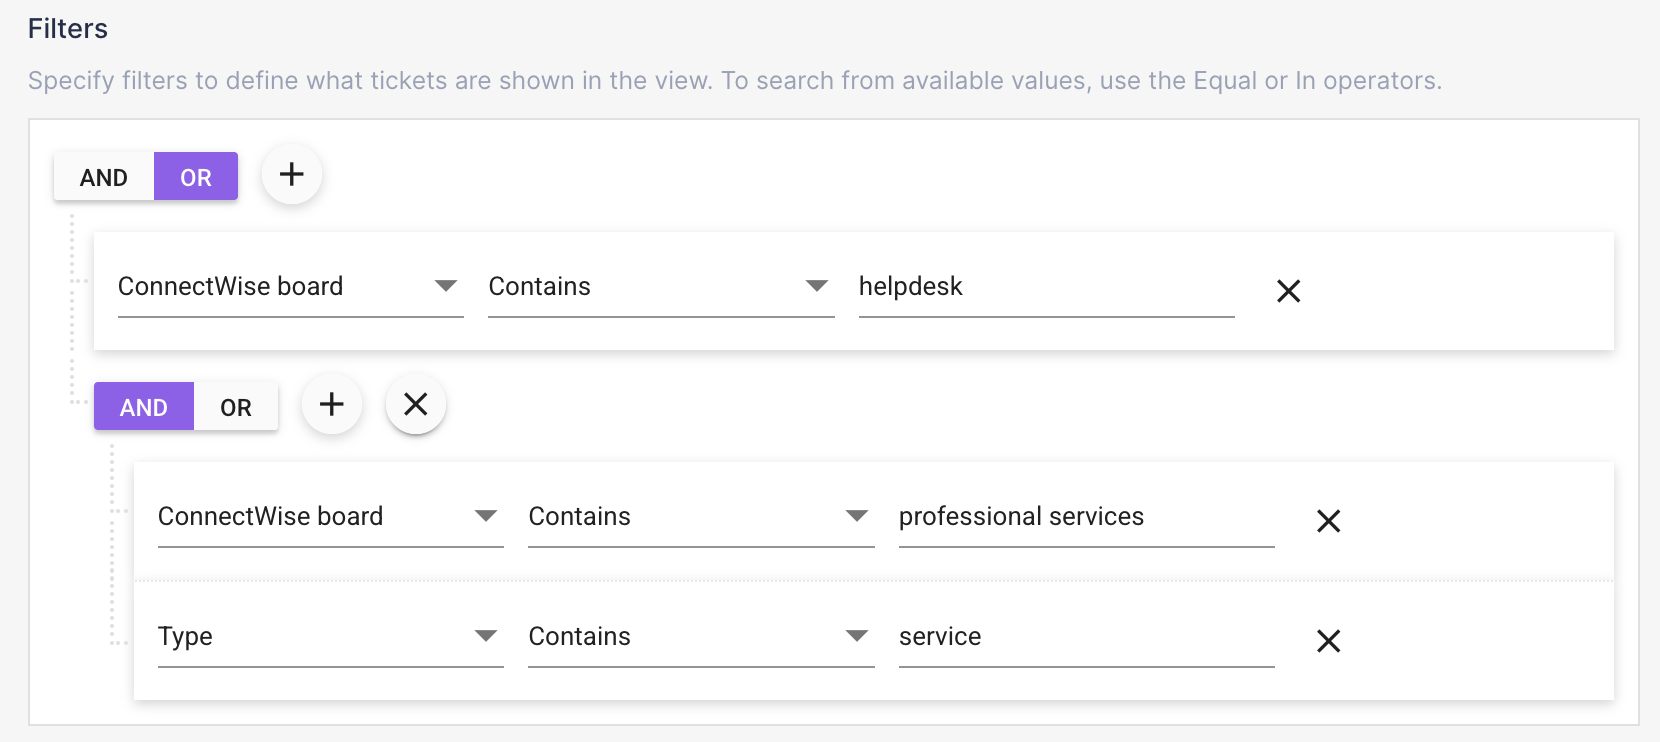
To choose which tickets appear on a board, views are set up using a flexible query builder. Compared to the old version, this lets you make use of boolean operators (and/or/not), searching by name (name starts with/ends with/contains), and it makes it easier to see which filter fields are in use.
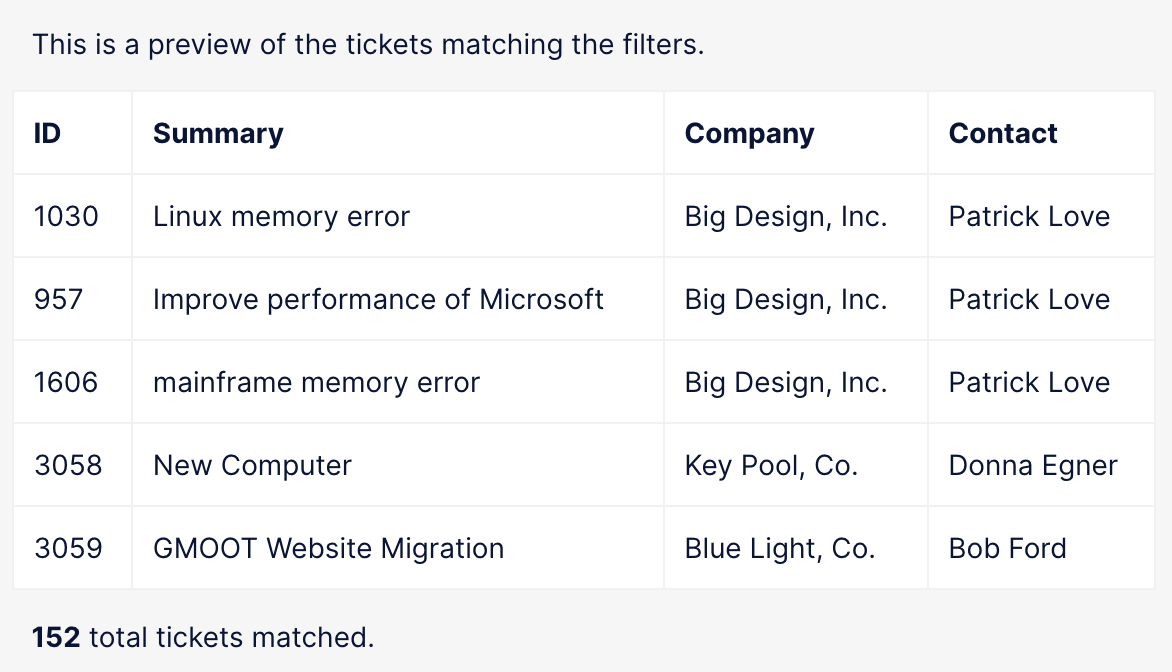
Preview records while building
To help you configure the view, there is a preview that returns a sample of your matched records. It updates as you update the query definition.
Owner association modes
Every MSP works in a unique way. Some MSPs assign tickets to members, while others set the owner of the ticket to a member. Previously TopLeft associated tickets with members based on assignments, but now you can choose how to associate tickets with members. For ConnectWise, you can choose either ticket owner or assigned members, and for Autotask you can choose either primary assignments only or also secondary assignments.

Grouping (swimlane) choice can be overridden
When setting up a view, you can choose the default way to group records on the board or Gantt chart. For example, you can group tickets by assigned member, priority, company, or a whole host of other options.
Users can override this choice when they view the board or Gantt chart.
Previously, if you wanted to use more than one way to group tickets, you needed to make one board for each choice. This would result in having multiple boards that were nearly identical. But now because the choice can be overridden, you can just make a single board and let users override the choice as they see fit.
Automatic per-person Work In Progress limits
When using Work In Progress limits, per-person limits are automatically used when grouping work by assigned person. In the old UI, per-person limits needed to be configured separately.
Column/status mapping is optional
In the new version, the relationship between Gantt charts and Kanban boards has been simplified. Since Gantt charts don't make use of the mapping of ticket statuses to columns, performing this mapping is an optional step. You only need to map statuses to columns if you intend to use Kanban boards.
Improvements for Board Users
The following improvements help engineers and managers make better use of Kanban boards and Gantt charts.
Free text search
Enter a search term to quickly filter the results on the Kanban board or Gantt chart.

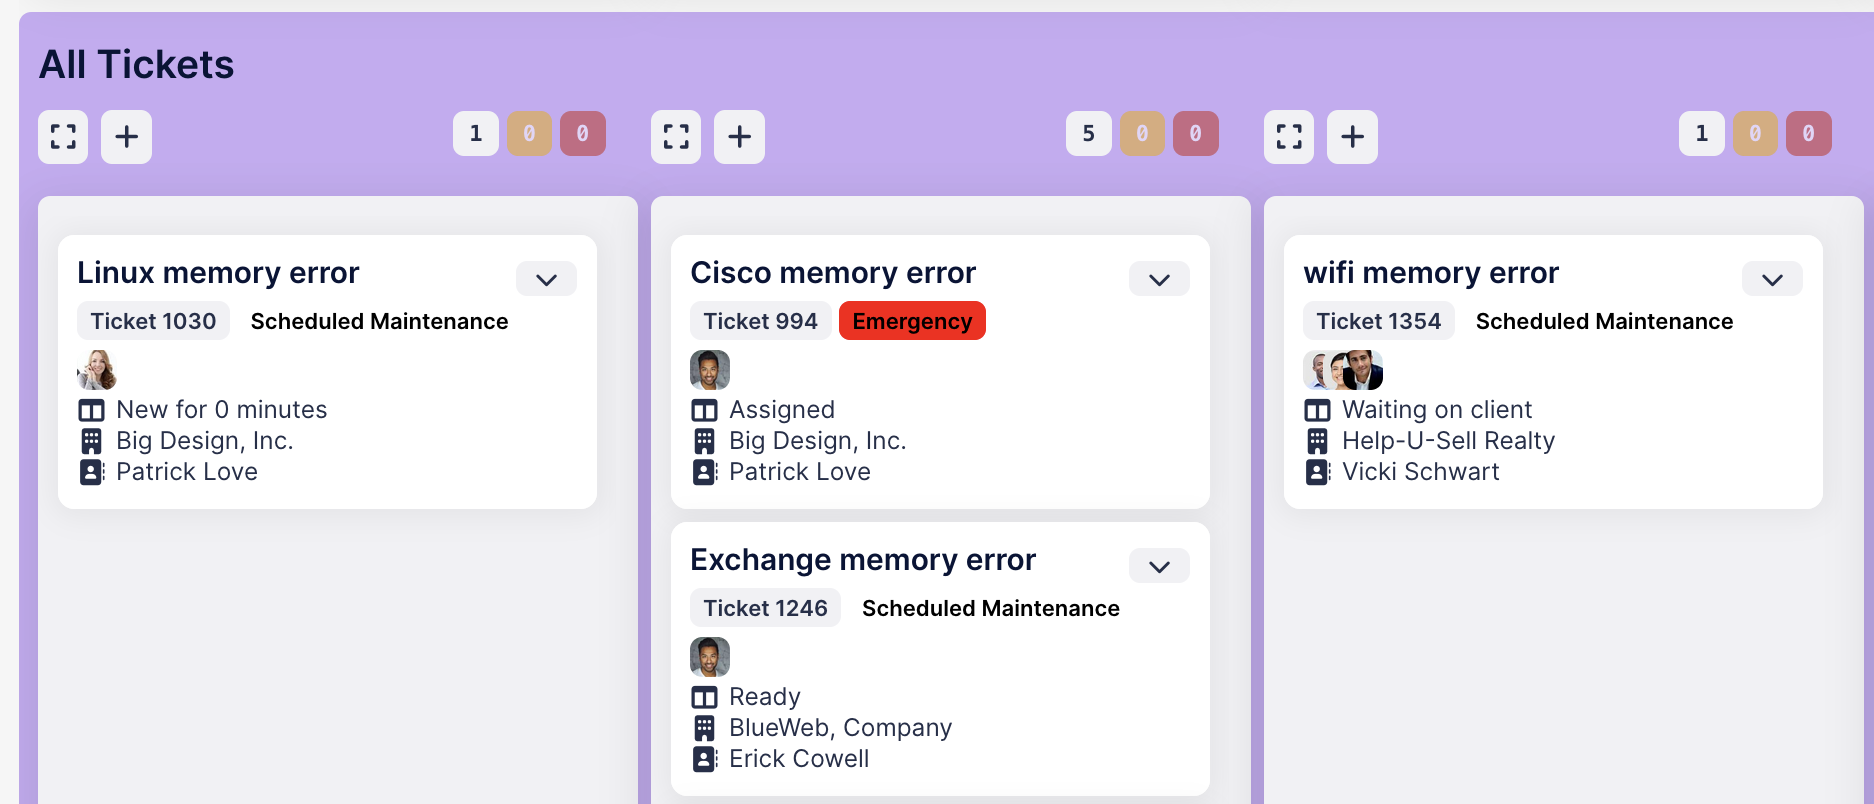
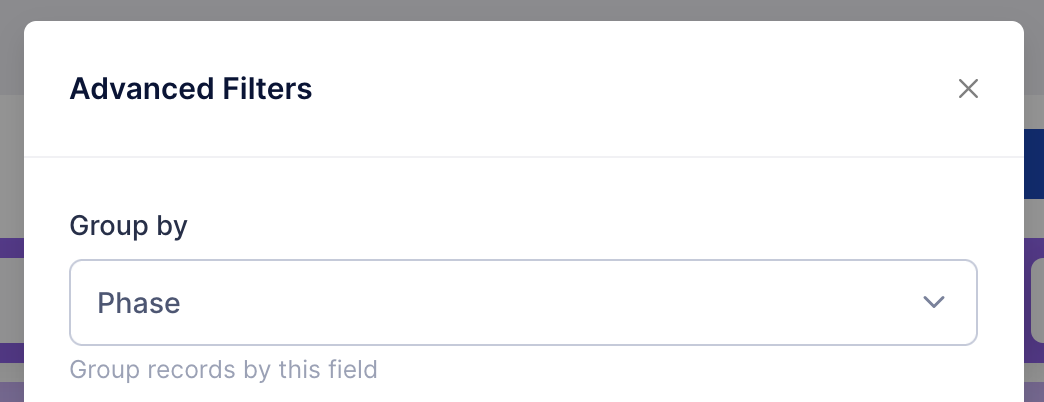
Easily change the grouping (swimlane) field
If the default grouping (swimlane) field choice isn't to your liking, you can easily choose a different grouping.
Filter to multiple members, companies, or projects
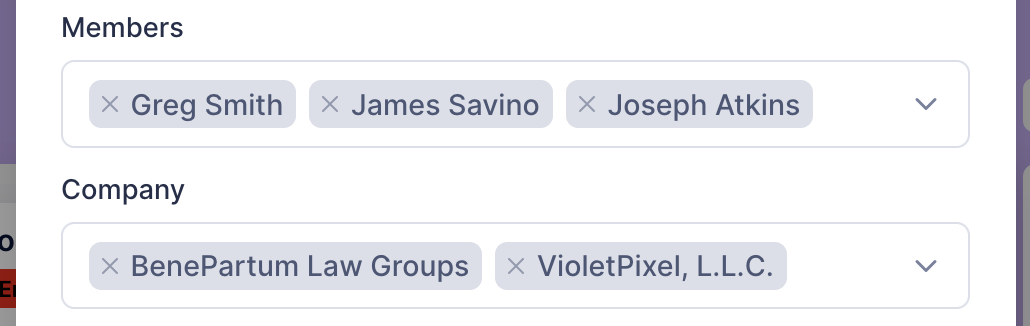
You can drill into work for certain members, companies, or projects. In the old UI, you could only select a single member, company, or project, but in the new UI you can filter for multiple records.
Faster performance
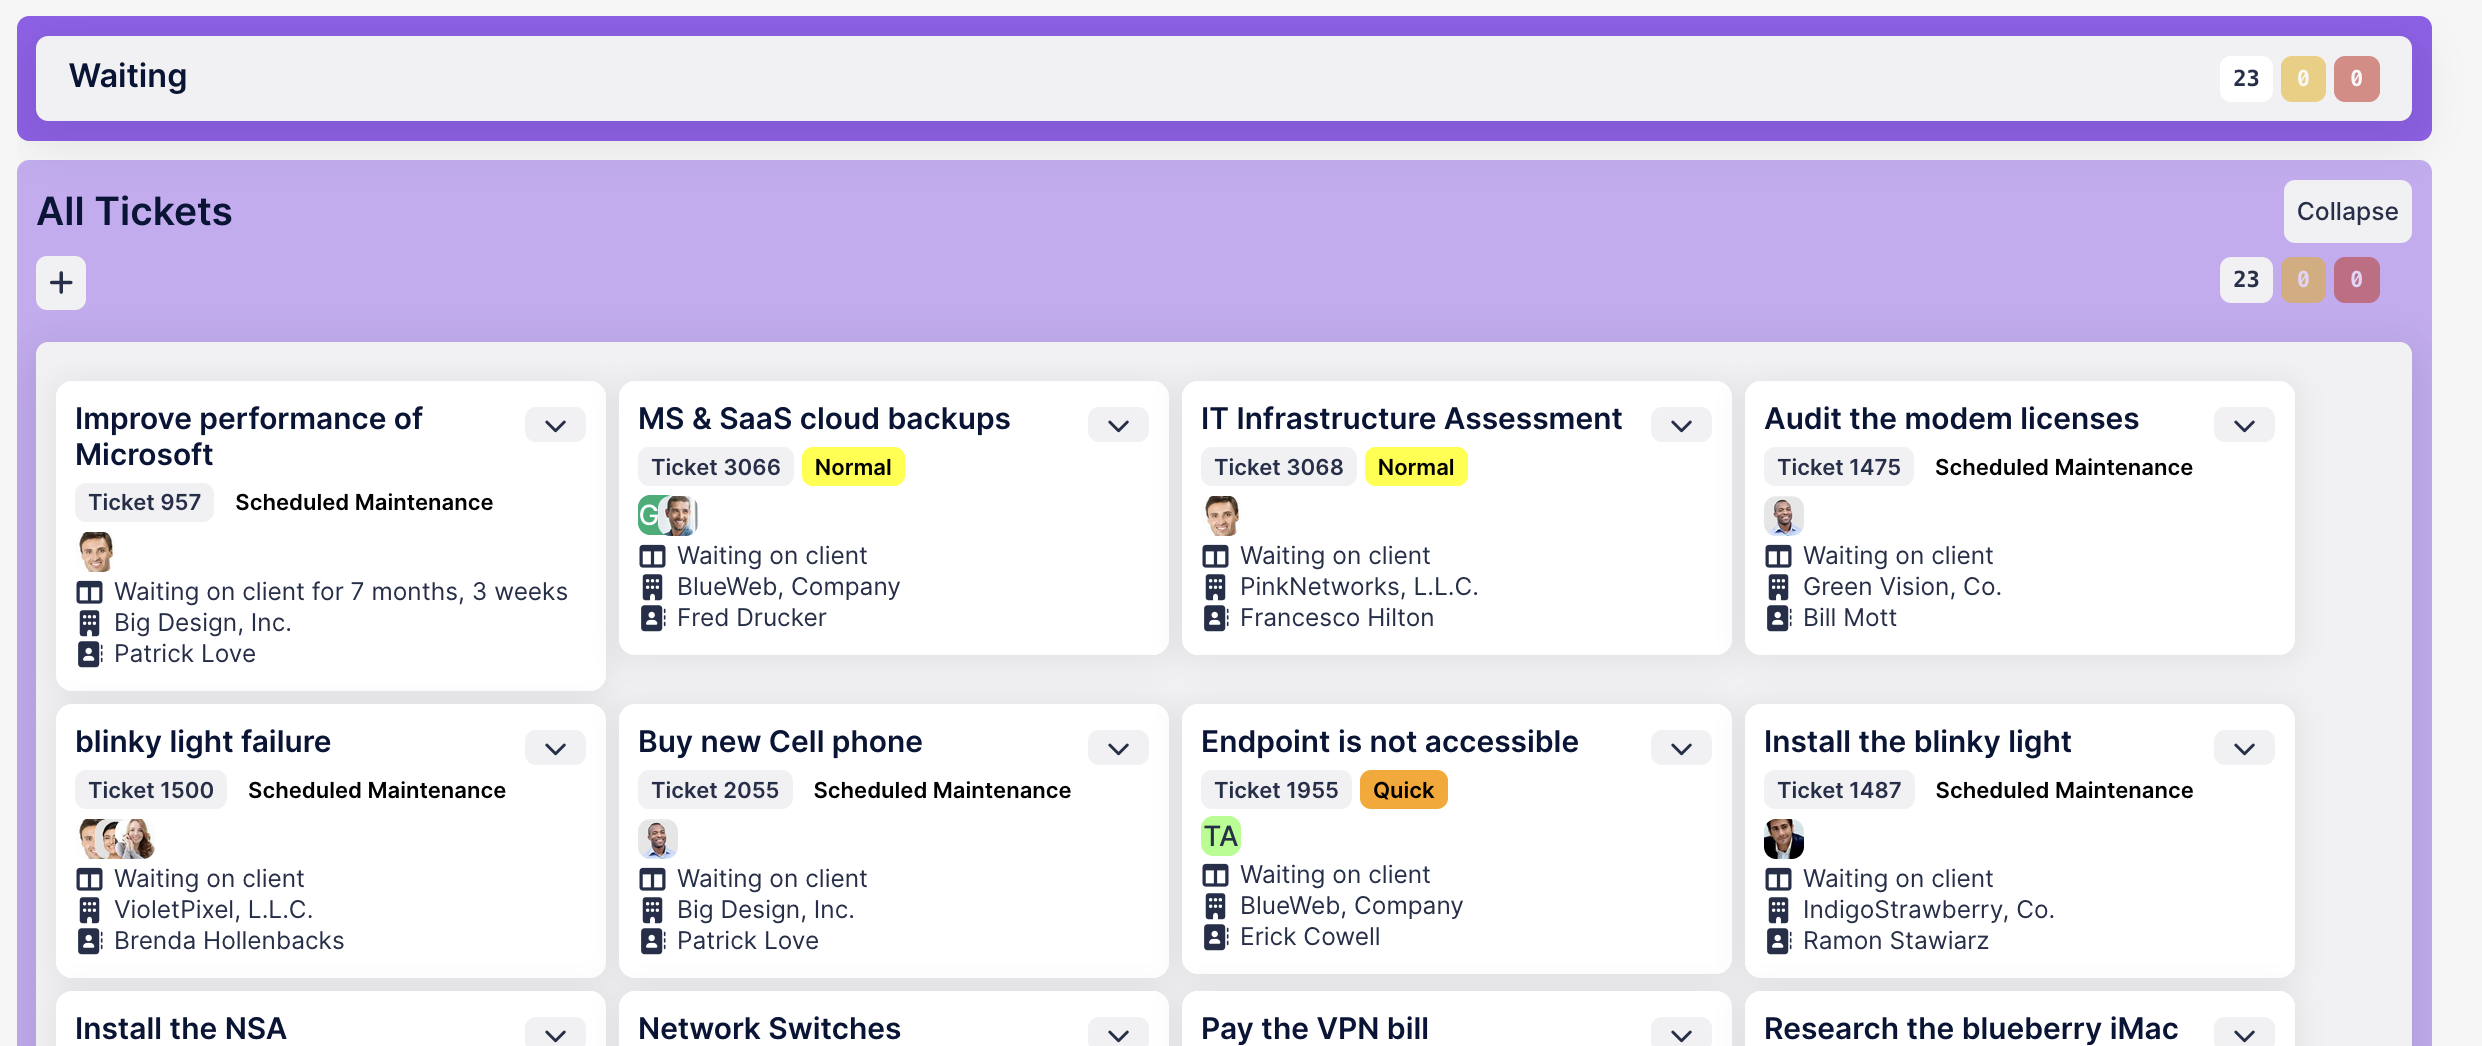
The board view loads faster than before, especially on boards with hundreds of tickets. In one of our tests, loading time was reduced by 65%.
Full screen mode
There's a new full screen mode that removes the navigation menus to let the board take the most space on your screen.
Zoom into any column or group
You can drill into groups or columns of cards with a single click.
Improved ticket editor
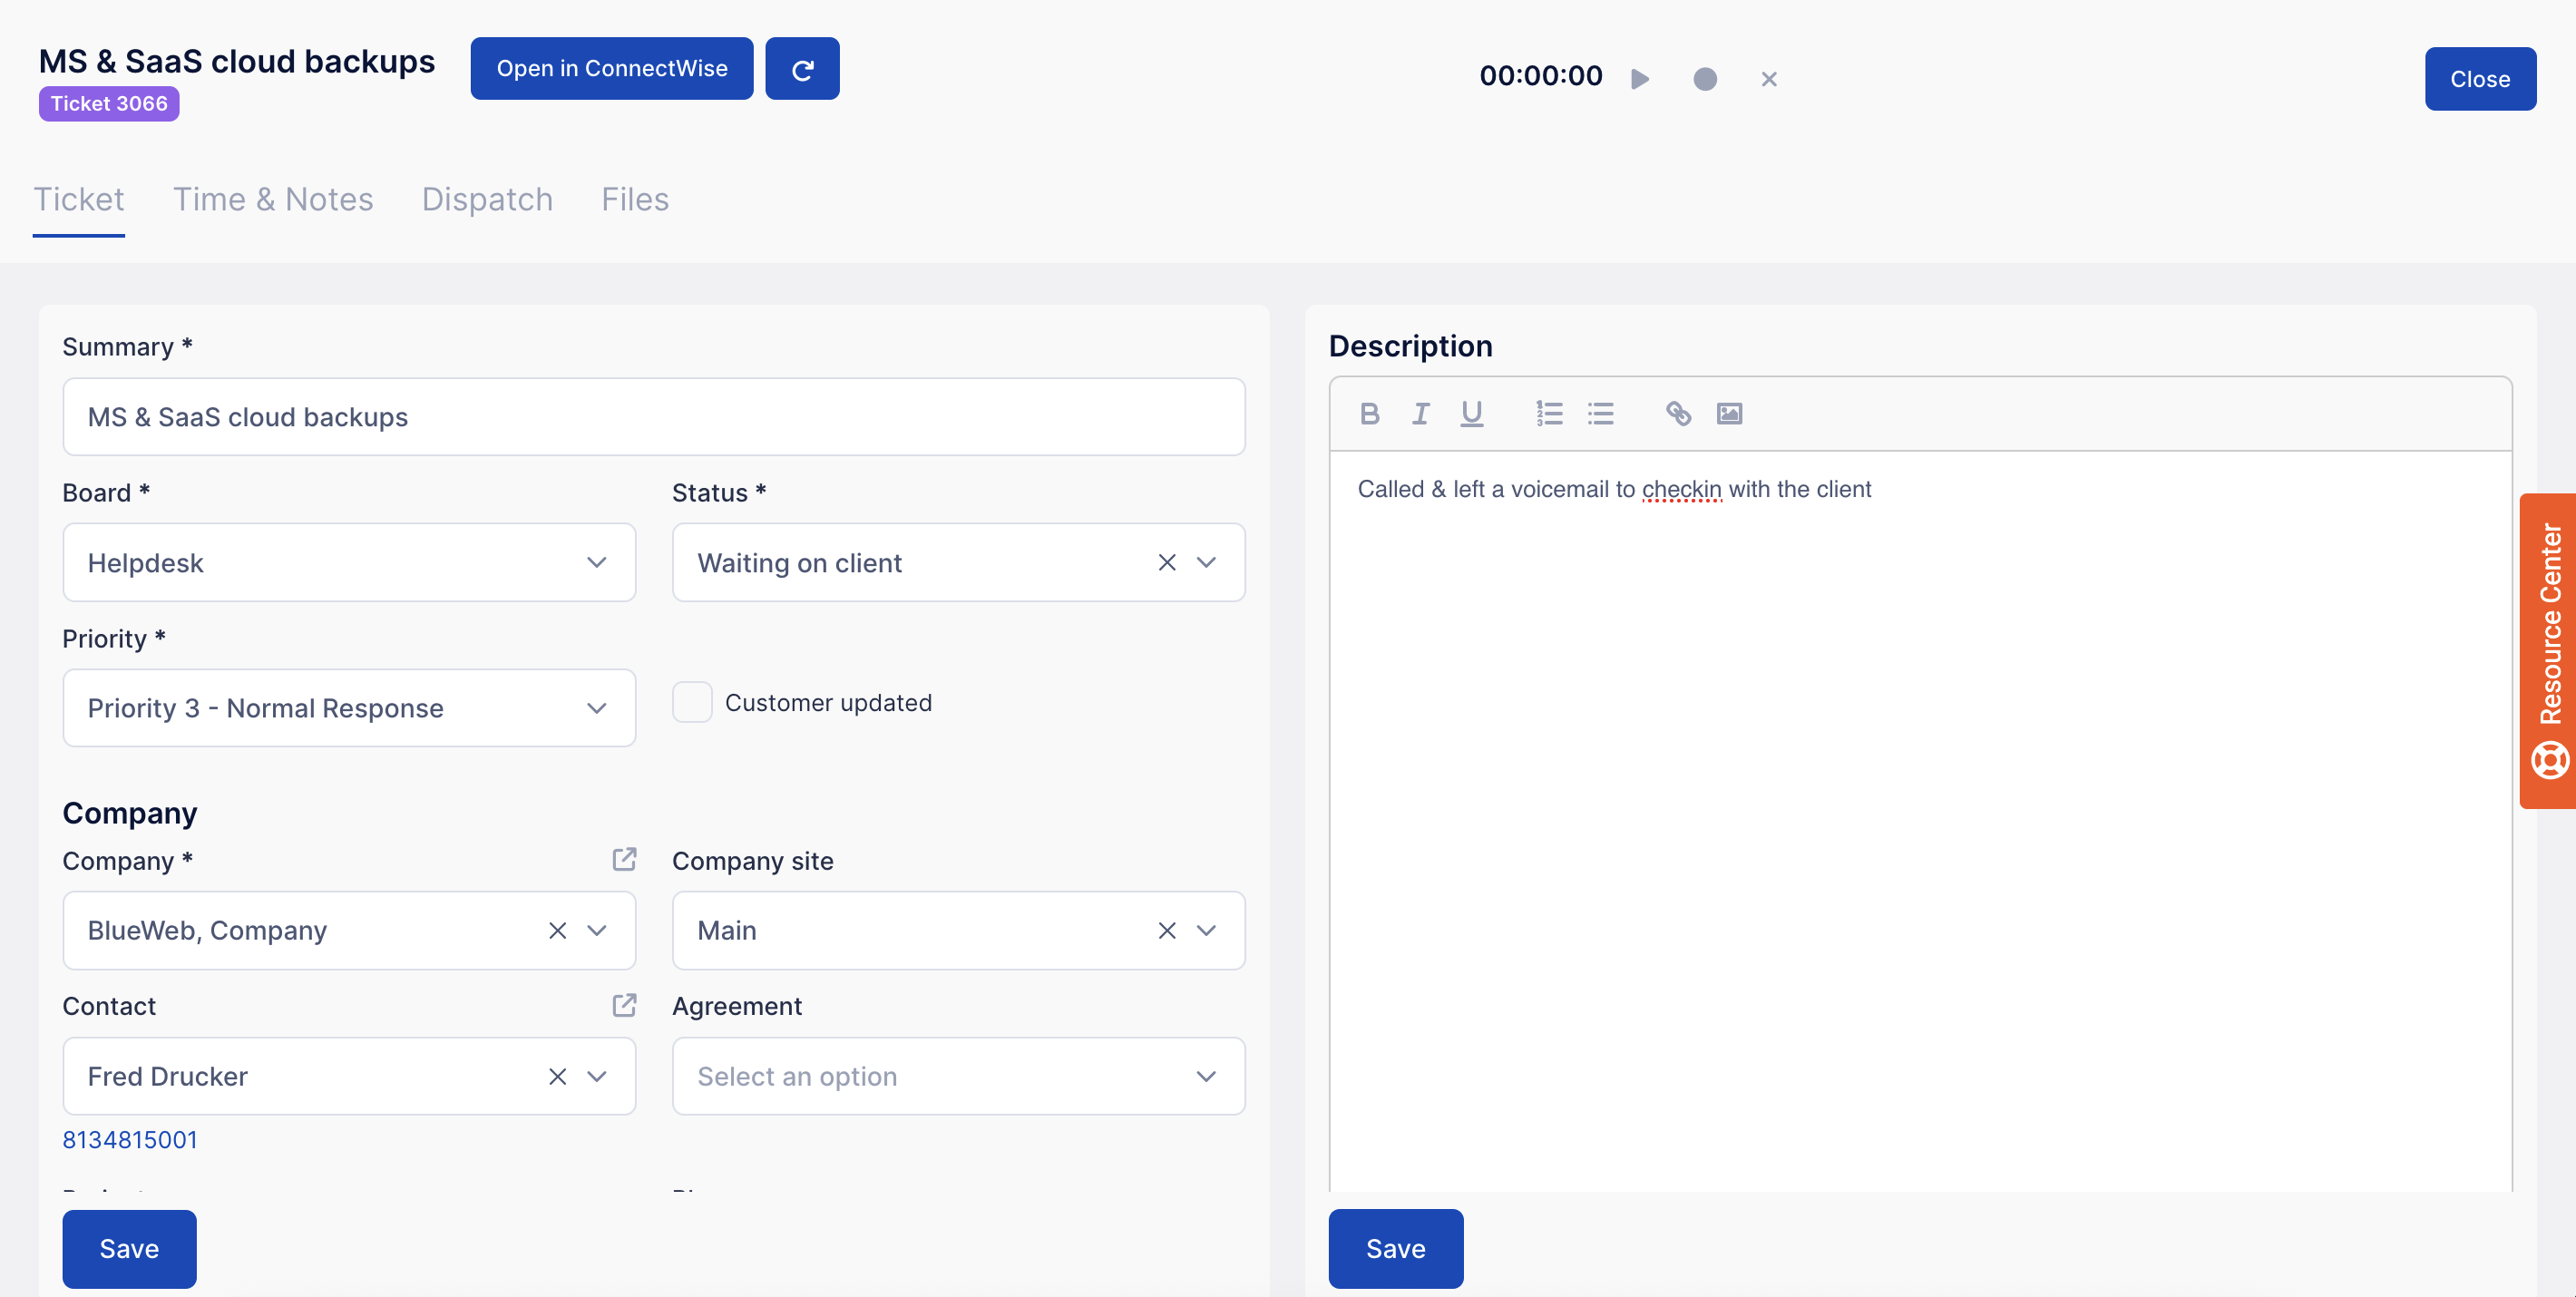
The ticket editor provides options for managing more data about tickets.
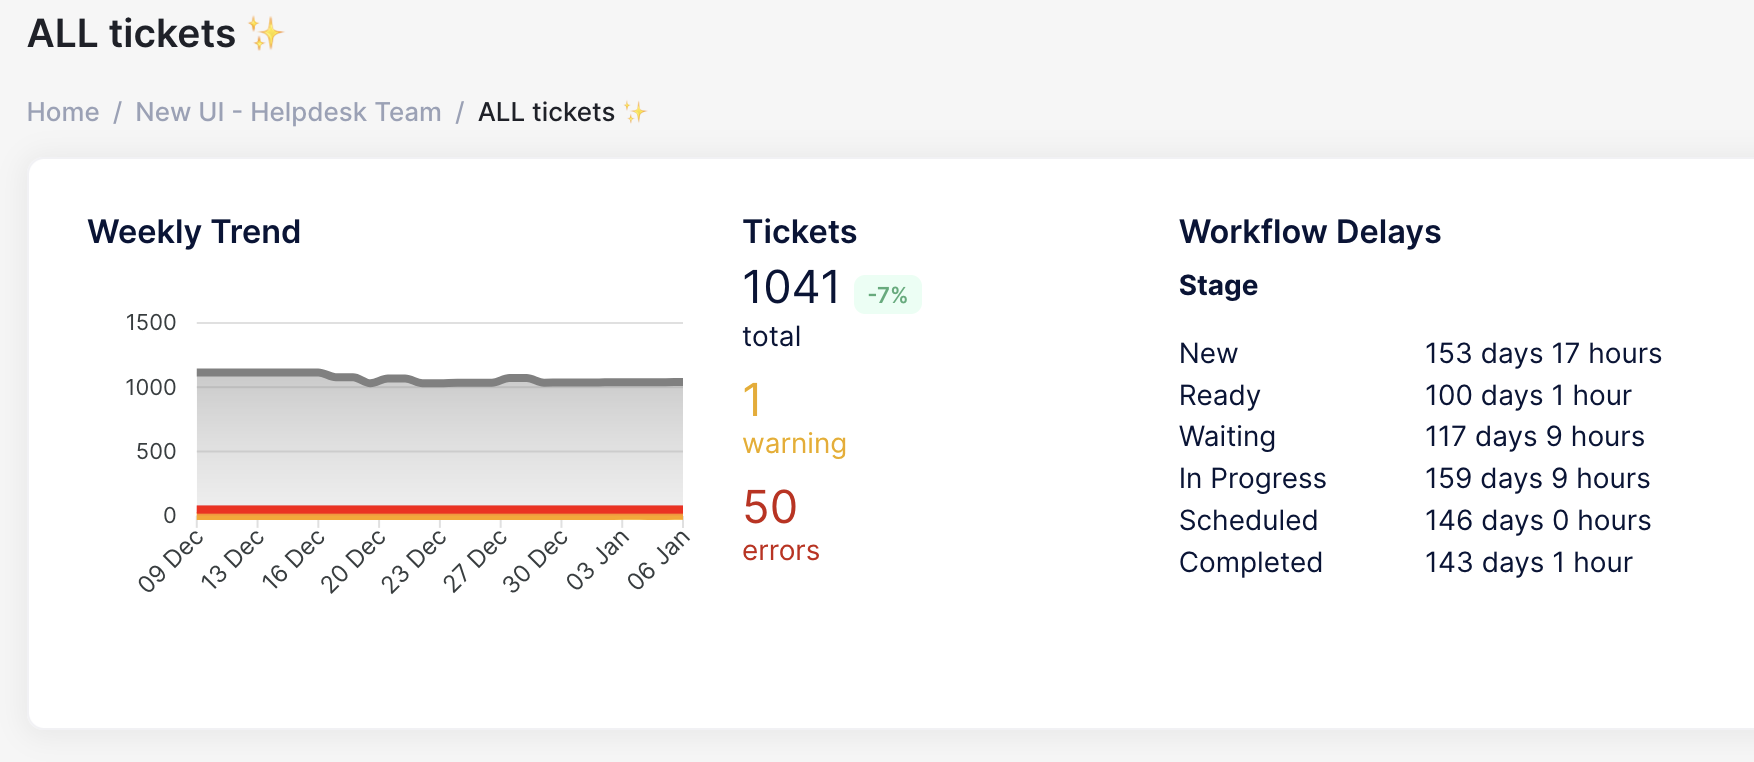
Historic charts for any view
You can now view historic ticket counts for any board. In the old UI, it was only possible to see this data for a single board for each team.
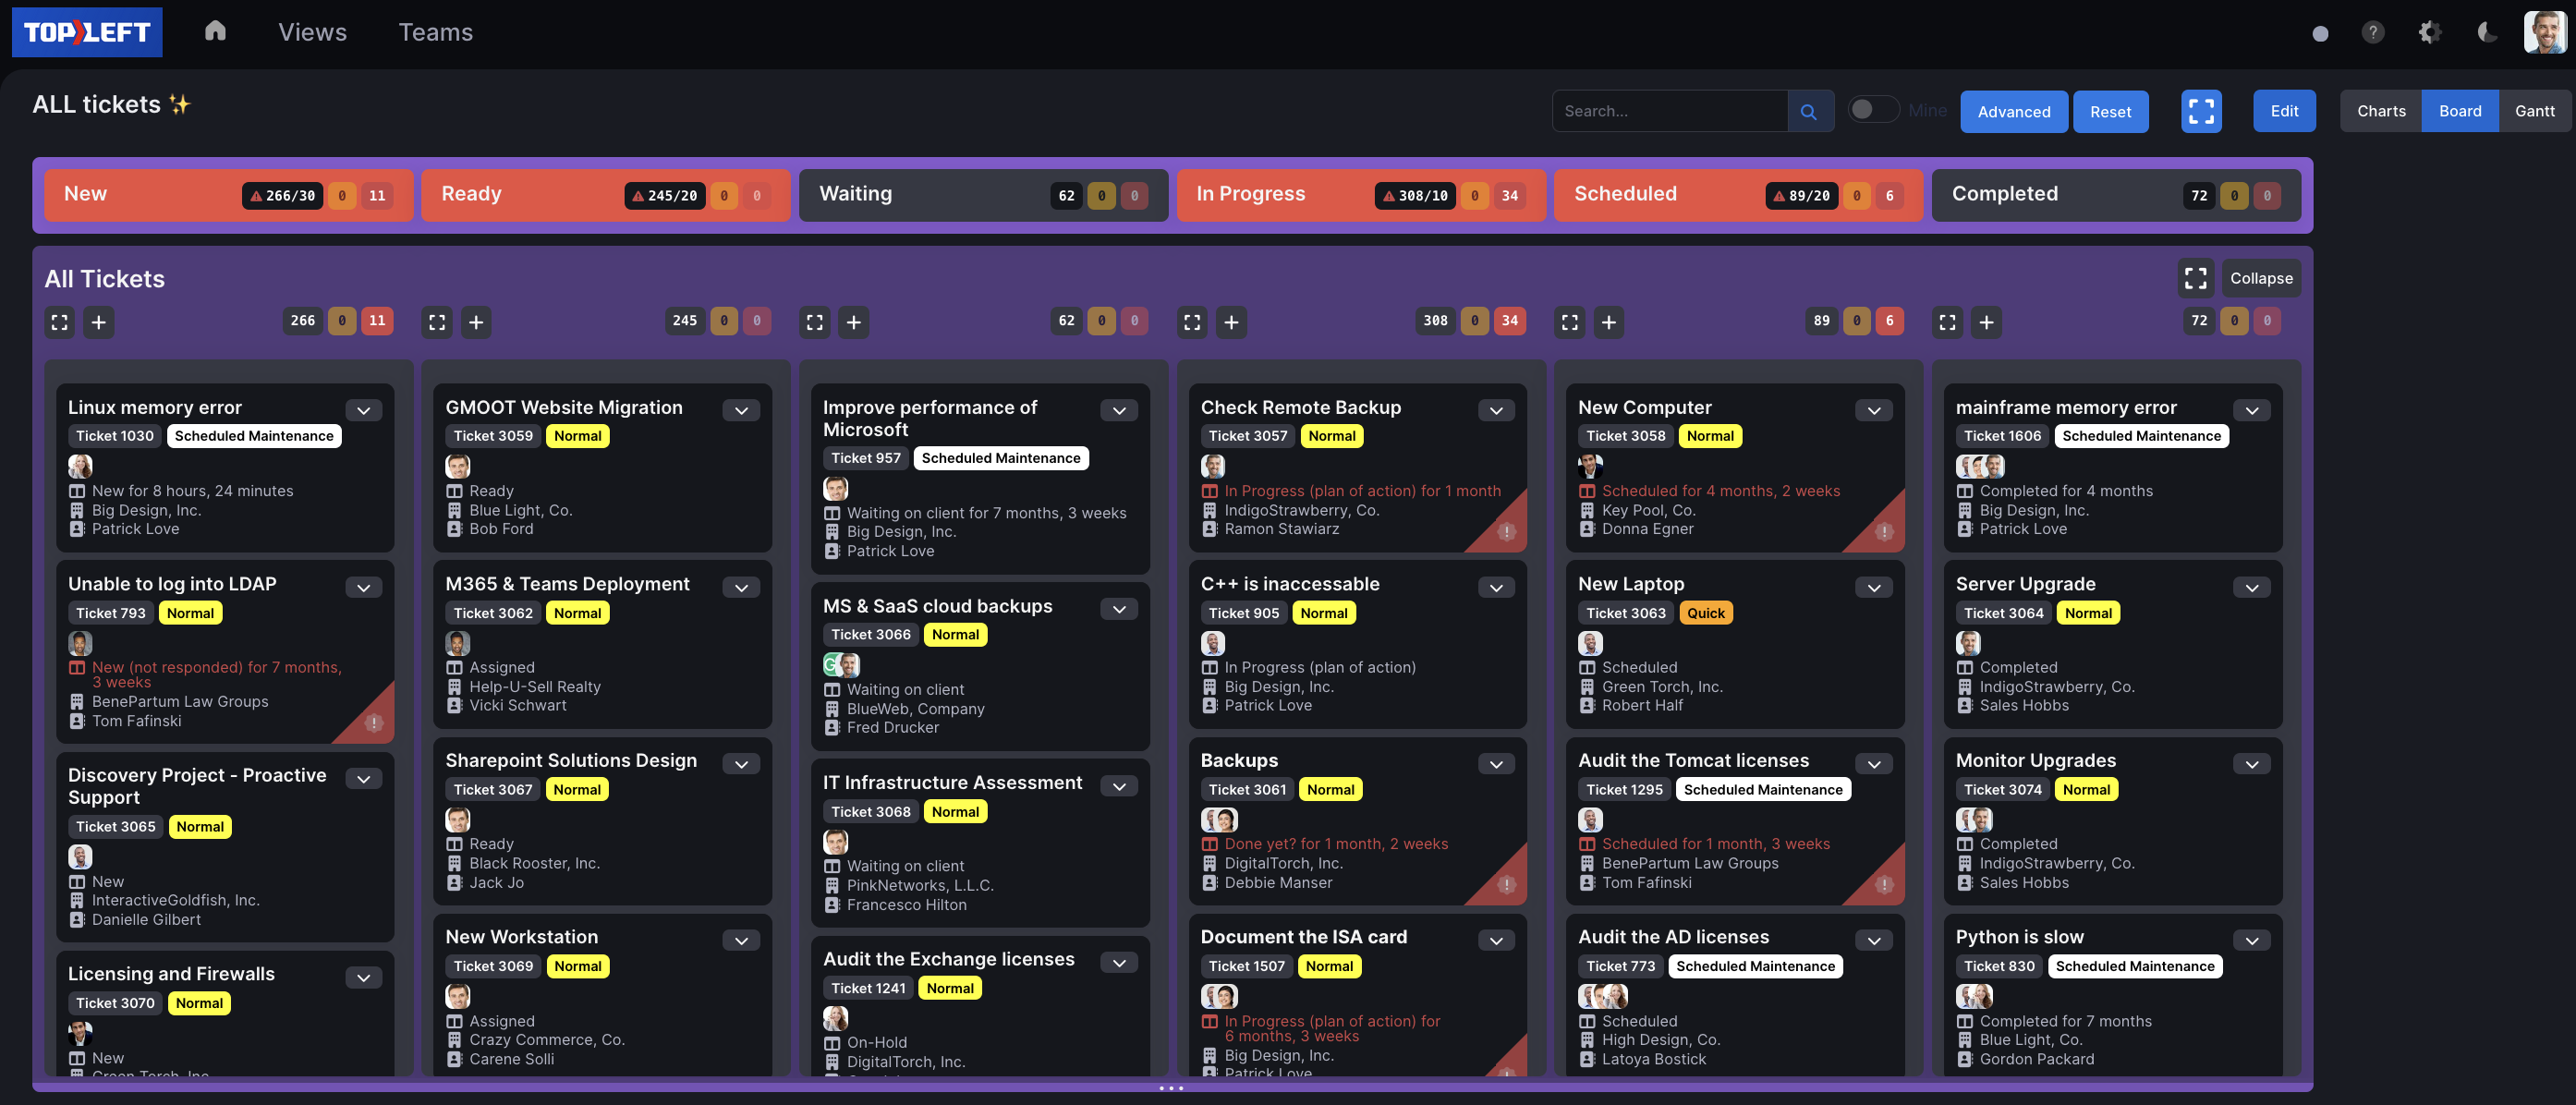
Dark mode
Dark mode is supported throughout the app.
What's Still To Come
We continue to work on the new UI. Next up:
- Metrics: summarize ticket metrics in groups and column- for example, show the average number of logged hours in the In Progress column
Watch this space!
Comments
No comments yet.