
Gantt Charts Improved and Available On All Licenses and In Client Portal
We have great news about Gantt charts in TopLeft. They're way better than before! Here are the highlights:
- Gantt charts are now available to users with Engineer and Viewer licenses, not just to those with a Manager license!
- Gantt charts are in the client portal.
- Tasks can be shown by assigned resources so you can plan work and avoid scheduling problems more easily.
- You can export charts to PDF.
- A whole bunch of usability improvements to make your day better.
Keep reading for the details...
Gantt Available to All Users
Gantt charts can help engineers visualize their upcoming work, so we've made them available to those with Engineer and Viewer licenses. Previously Gantt charts were only available to Managers. Engineers can drag taskbars to change dates, while Viewers get a read-only view.
As with the Kanban boards, Engineers and Viewers can see tasks on the Gantt chart that are either unassigned or assigned to a user licensed in TopLeft. As always, those with a Manager license can see tasks assigned to anyone.
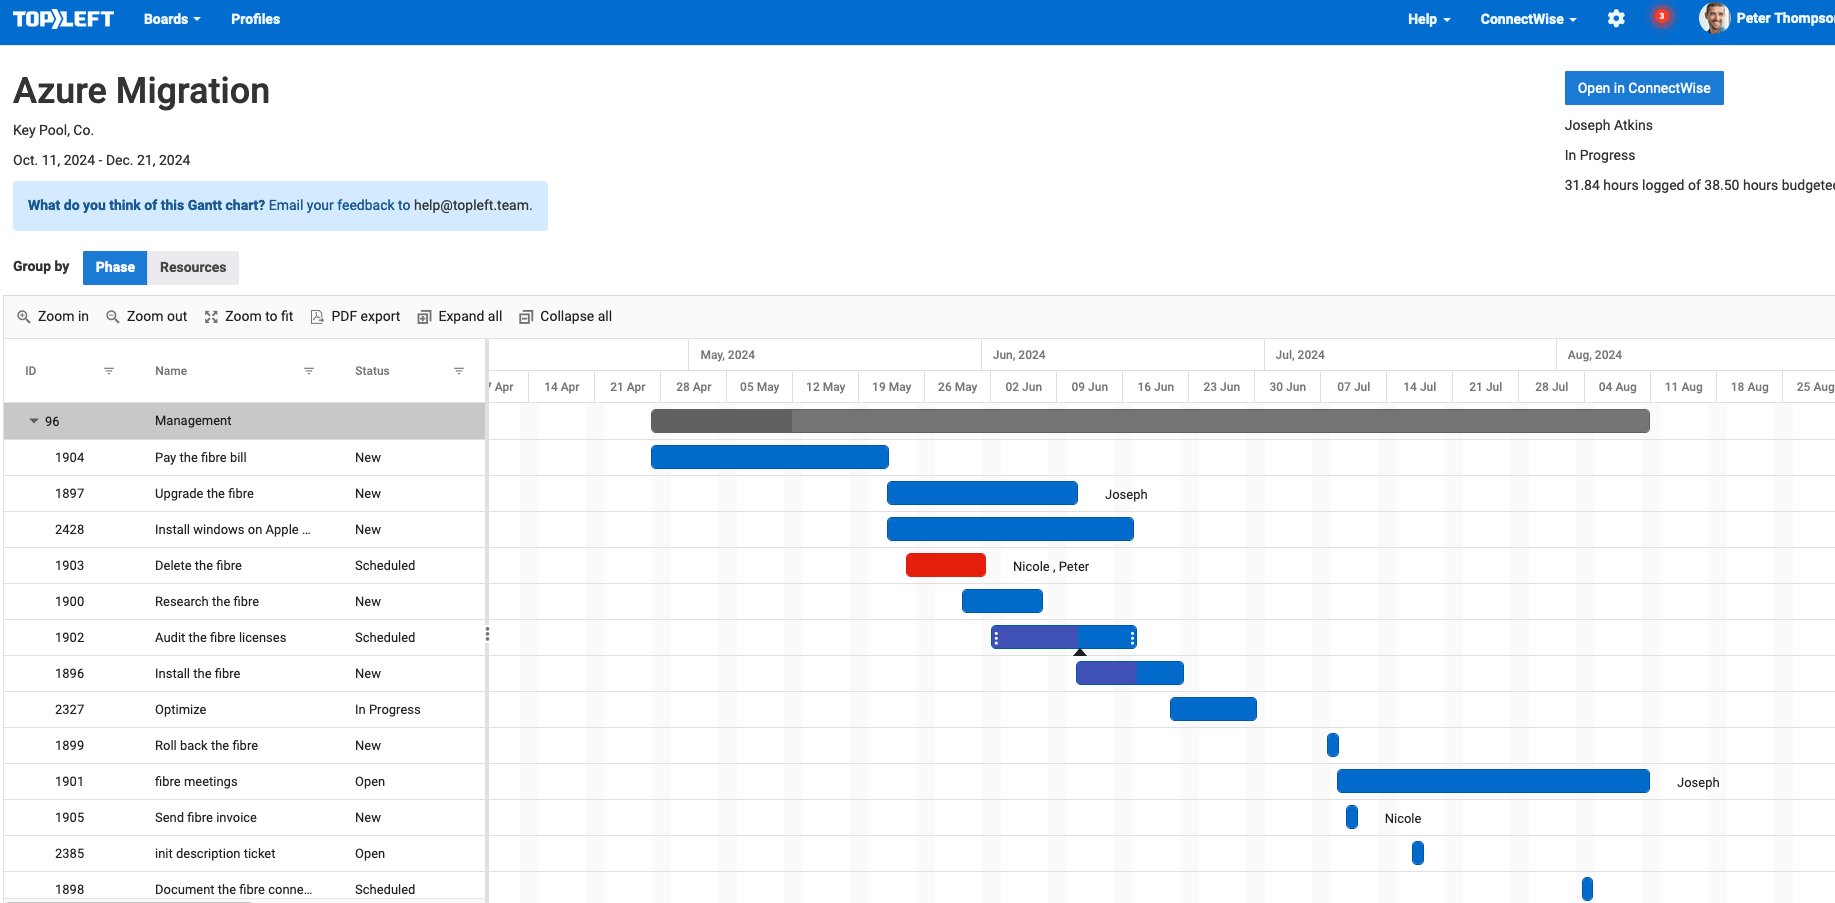
Gantt Available in Client Portal
Your clients also benefit from seeing project plans visually, so we've made Gantt charts available in the client portal- both the built-in client portal and the CloudRadial version.
Your clients can view Gantt charts from a Kanban board with project or project phase swimlanes.
To see a Gantt chart for a single project, your client can click the link in the swimlane header of the project.
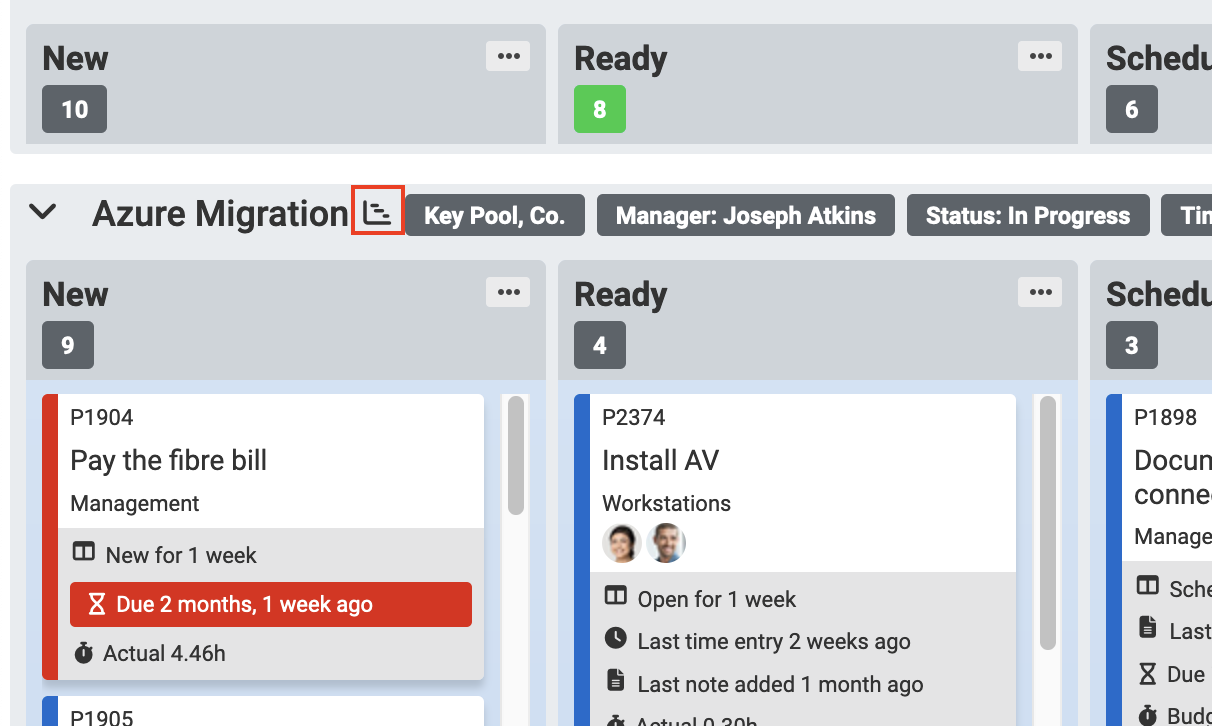
To see a timeline of all their projects on the Kanban board, the client can click the link in the page header:

Show Tasks by Assigned Resource
To make it easier to see how work is scheduled among the engineers on your team, now you can organize tasks by their assigned resources.
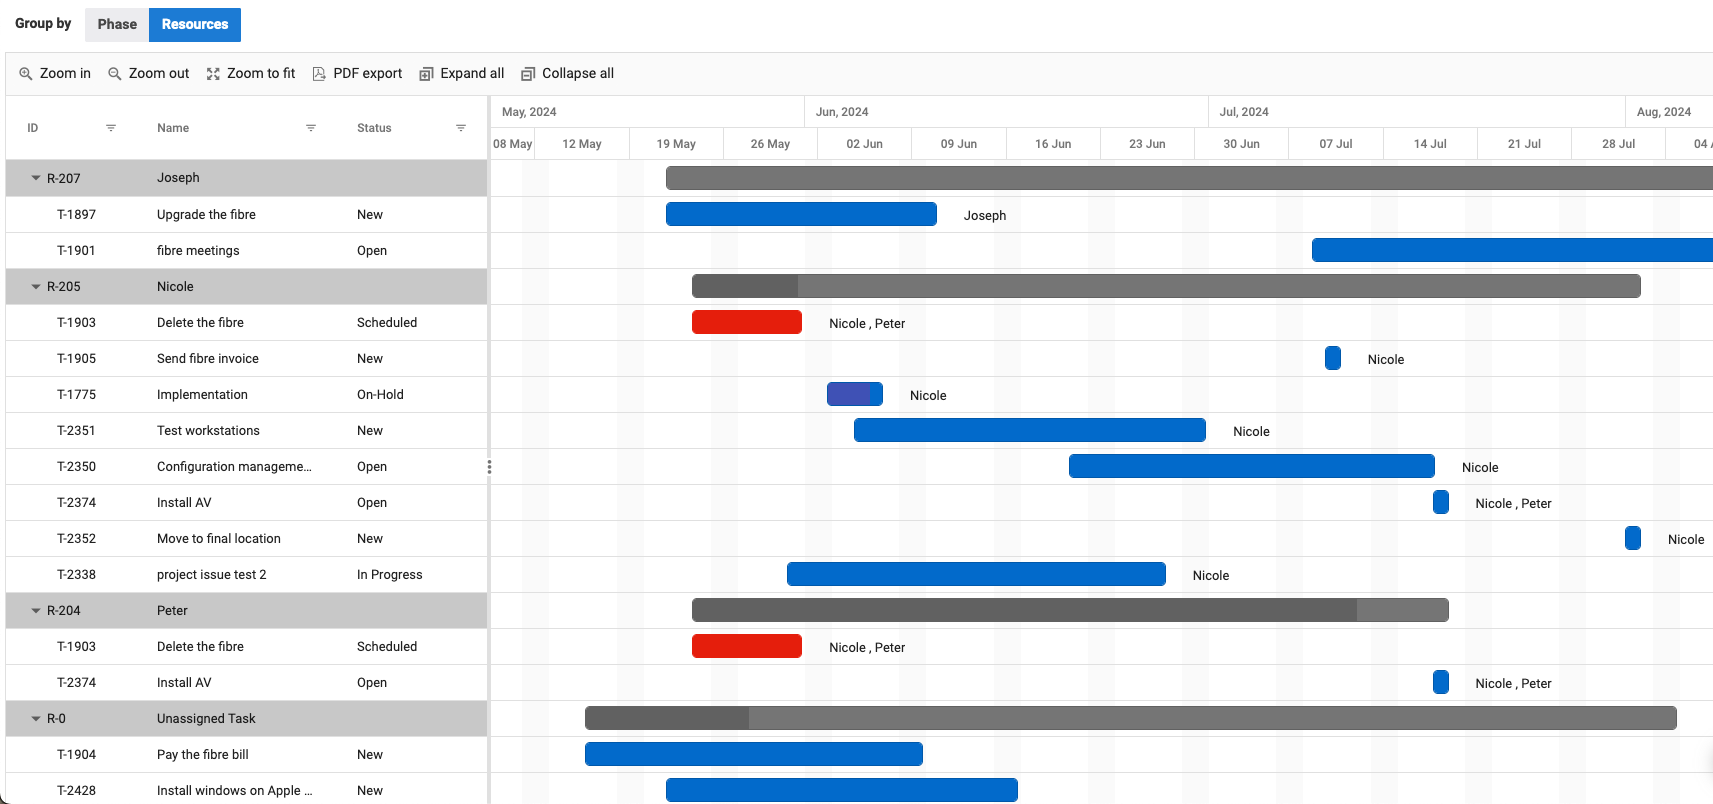
Also, the names of the assigned members are shown beside each task:

PDF Export
Click the button. Get a PDF file of your Gantt chart.

Usability Improvements
We made it easier to use the Gantt charts. Some improvements include:
- Gantt charts use the same ticket filters as the Kanban board from which they are launched, so you see on the Gantt chart exactly what you saw on the Kanban board.
- It's much easier to scroll horizontally.
- Your display choices are persisted between page loads.
- It's easier to collapse or expand groups of tasks by using the new buttons in the task bar.
- Colours are clearer and we removed some strange artifacts that would sometimes appear on taskbars.
Comments
No comments yet.