
Visualizations of Views
The ways a View can be shown (Kanban board, Gantt chart, charts report, capacity planning) and how to switch between them.
Legacy interface
A View represents a search for tickets, projects, or other records in your PSA data and is presented in a variety of ways:
- Kanban boards
- Gantt charts
- Charts report with a timeline of record counts over time with highlights of problematic records and summary of workflow performance
- Capacity planning tools
To open a visualization of a view, do one of the following:
- On the dashboard, find the View and click one of the navigation links on the left side.
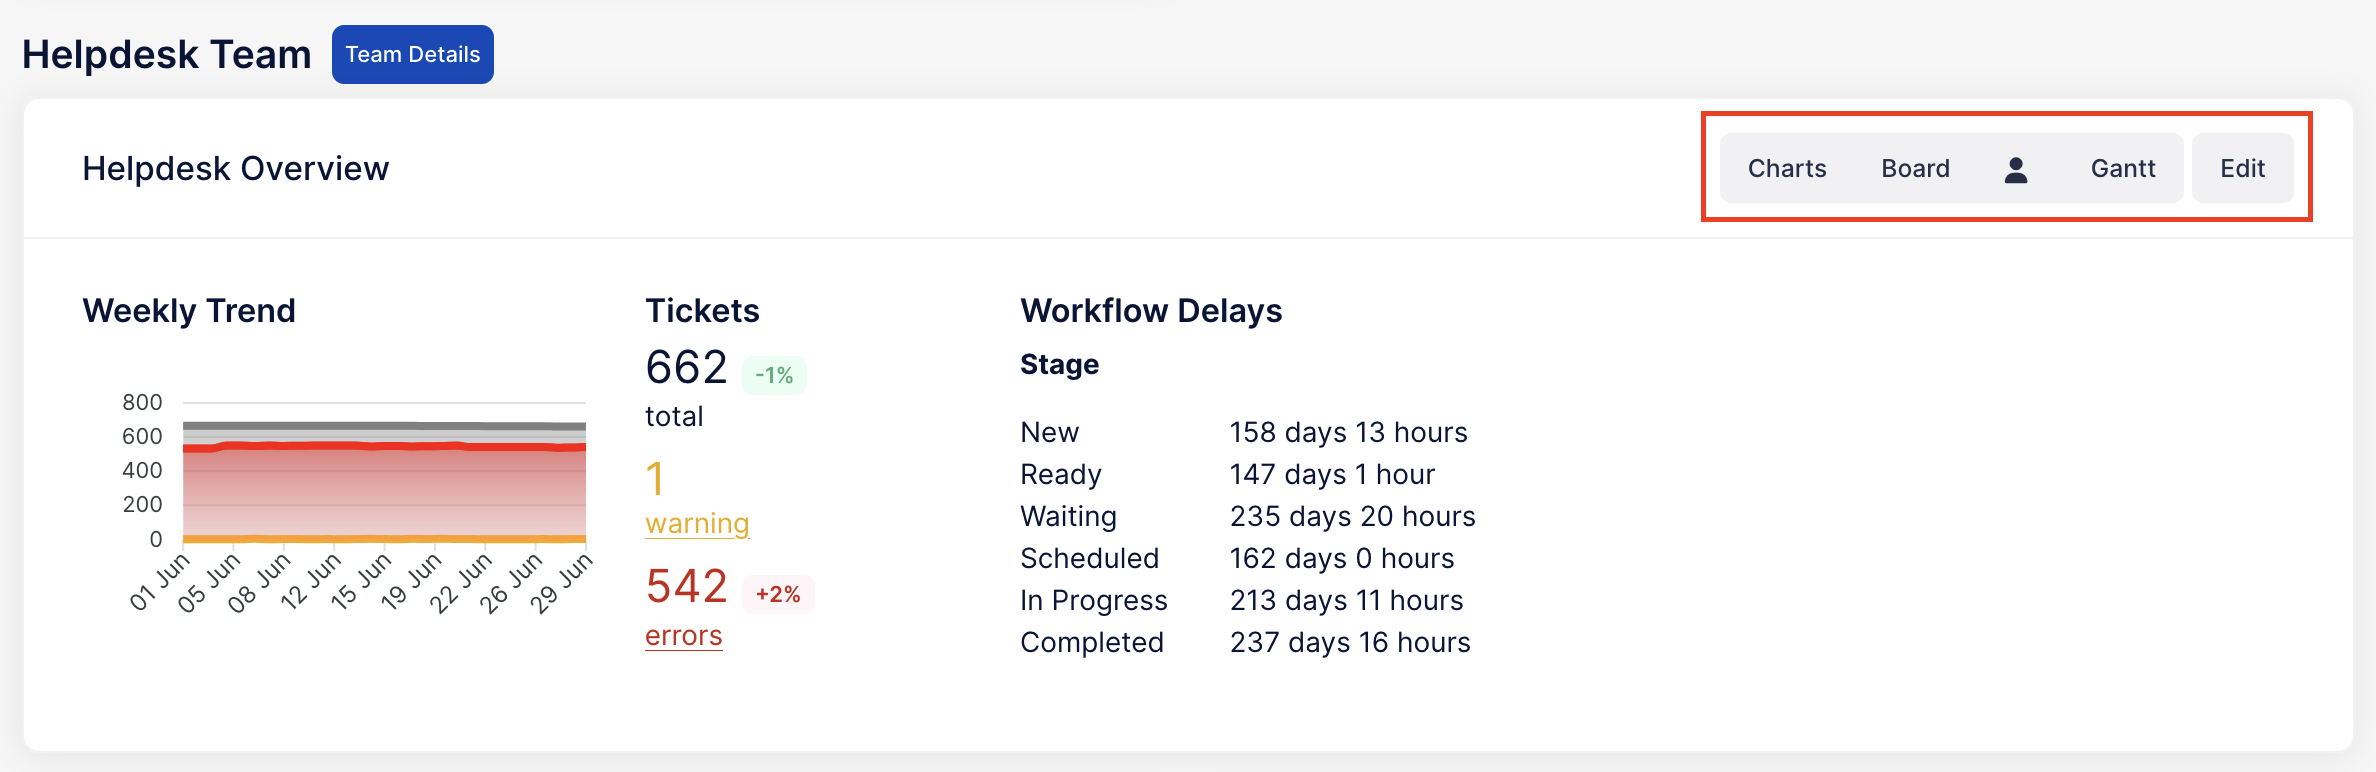
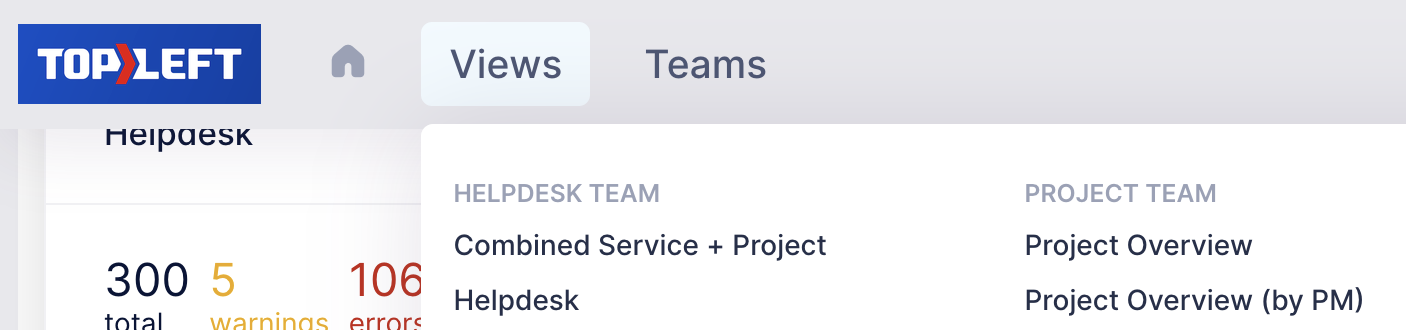
The person icon navigates to the board view with Mine mode enabled, showing only your own work. - In the main menu click Views to open the list of Views, then click the View name to go to the board visualization.
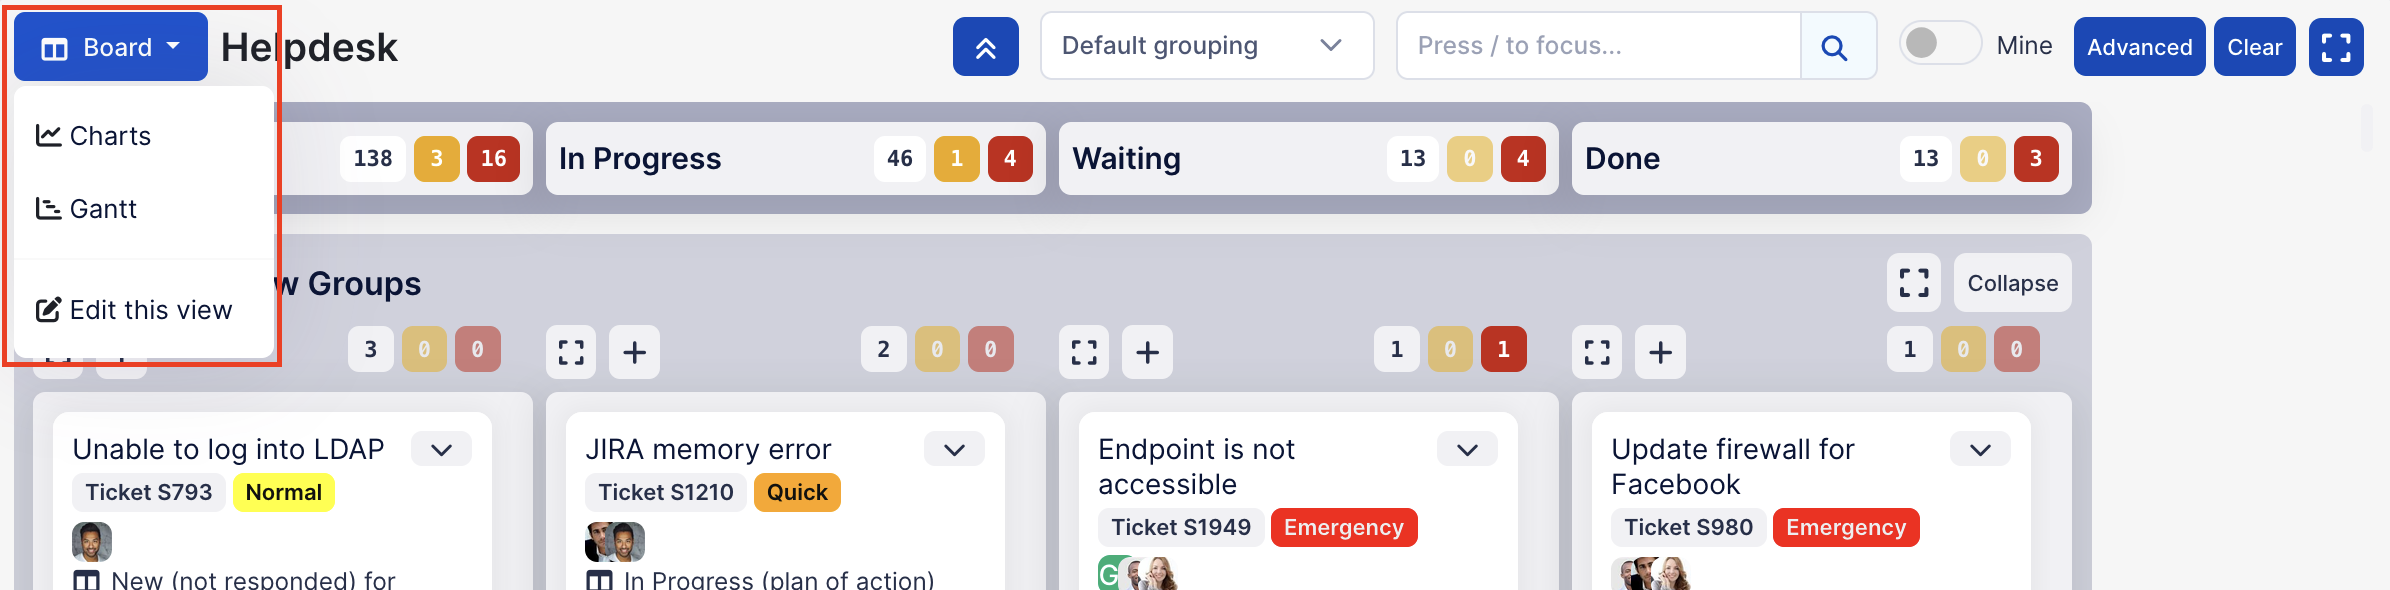
When you're already in a visualization of a View, you can navigate to a different visualization using the button to the left of the View name.
Customizing Visualizations
You can search within a visualization or make changes to how it presents the data. These options are available in the visualization header:

Grouping: override the default grouping of the view to show records grouped by a different field
Search: search for text within the default set of results
Mine: show only work assigned to you, optionally with unassigned work depending on the option in the Advanced pane
In the Advanced search dialog:
- Members: show work assigned to the selected members
- Company: show work for the selected companies
- Project: show work for the selected projects
- Unassigned records: whether or not to show unassigned work
- Problem record filtering: optionally only show work with warning and/or error indicators
- Card labels: optionally limit card labels to only essential labels, saving vertical screen space to show more cards on a single screen
Your customization selections are reflected in the page URL, so you can send the URL to coworkers or bookmark the page to return to it easily with the customizations already applied.
Updated September 23, 2026