
Integrate with Nave - Kanban charts
Legacy interface
Nave is a Kanban analytics tool that helps you increase efficiency and minimize waste. It monitors your teams' tickets and tasks over time and shows charts to help you identify bottlenecks and improve your process.
TopLeft can export data to Nave dashboards so you can see how your team is performing and make improvements.
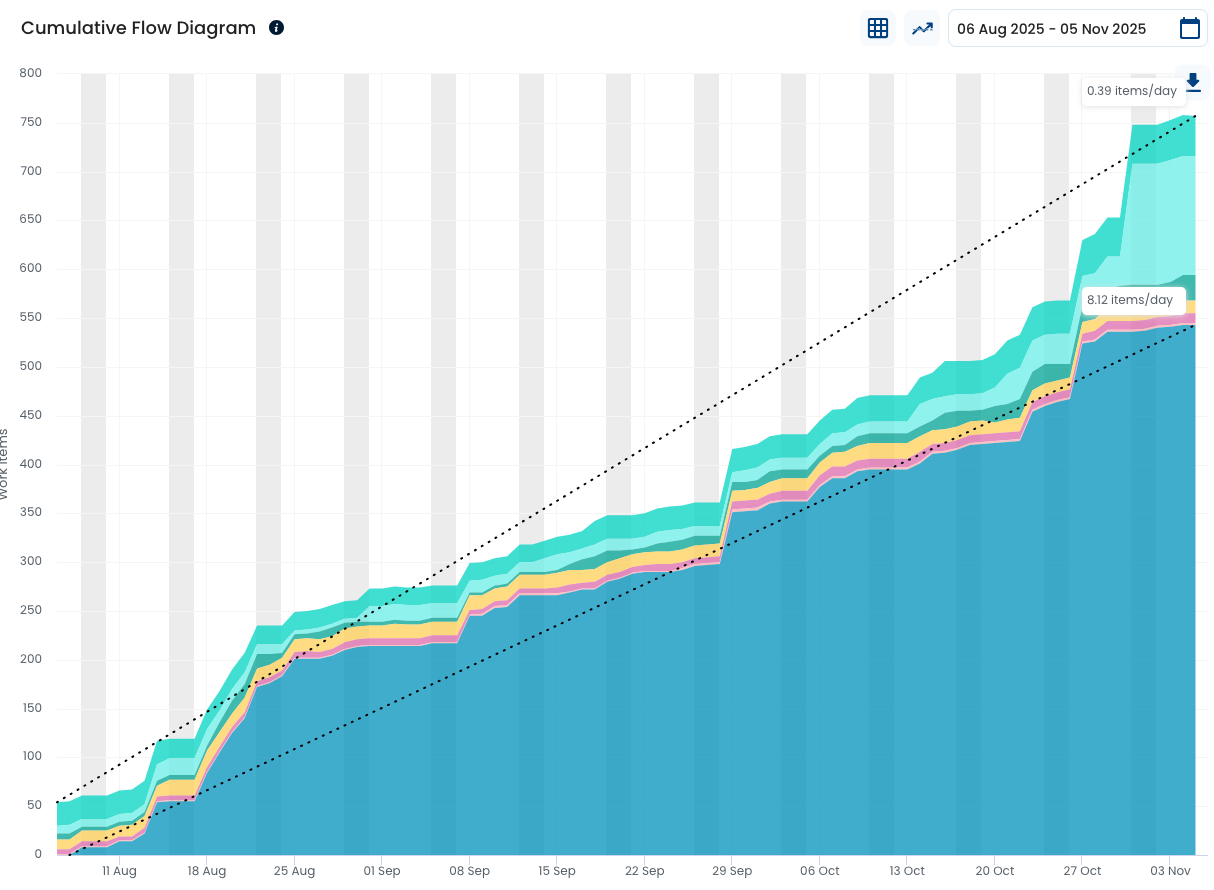
As an example, Nave offers a cumulative flow diagram (shown below) that tracks the number of tickets in each Kanban board column over time. This helps you see in what columns and at what times tickets stalled, where work accelerated, and whether your team is completing work faster than new work arrives. Nave also offers charts that identify particular problem tickets and overall efficiency trends.
Learn more at GetNave.com.
Nave Resources
Setting up Nave in TopLeft
Follow these steps to see your workflows tracked in Nave.
Administrators configure Nave in TopLeft from the Settings > Nave Kanban Charts page.
Environment Setup
First, sign up for a 2-week trial of Nave.
Second, get your API token from Nave and save it in TopLeft. From the top menu in Nave, click the user icon, then click Get Access Token.
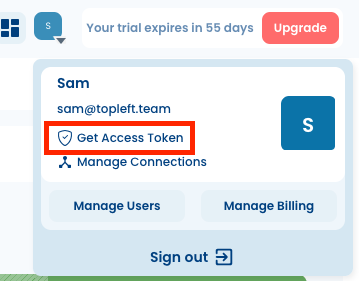
The access token is saved to your clipboard.
In your TopLeft settings, under Apps click Nave Kanban Charts, then paste the token in the API key field and click Save.
Set Up Nave Dashboards
For each Kanban board you want to associate with a Nave dashboard, do the following steps. Choose a board that tracks the whole workflow for a team. It doesn't matter if the board has swimlanes, since swimlanes are ignored in Nave.
Click the name of the Kanban board in the list at the bottom of the configuration page. You are sent to a page with details for that Kanban board.
Download the Nave export file to your computer.
In Nave, create a new dashboard. You can go directly to https://file.getnave.com/create, or in the user menu, click Manage Billing.
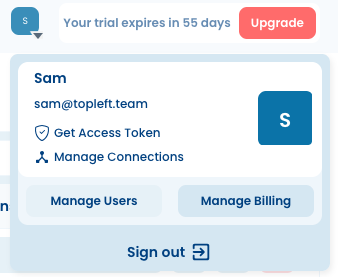
Then on the billing management page, click the plus button, then Create Dashboard.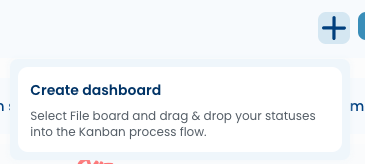
Enter a name for the dashboard. We suggest to make the Nave dashboard match the TopLeft board name.
Drag and drop the export file in the "Drop your file here..." section.
Map the columns of the Kanban board to the To Do, Doing, and Done sections in Nave.
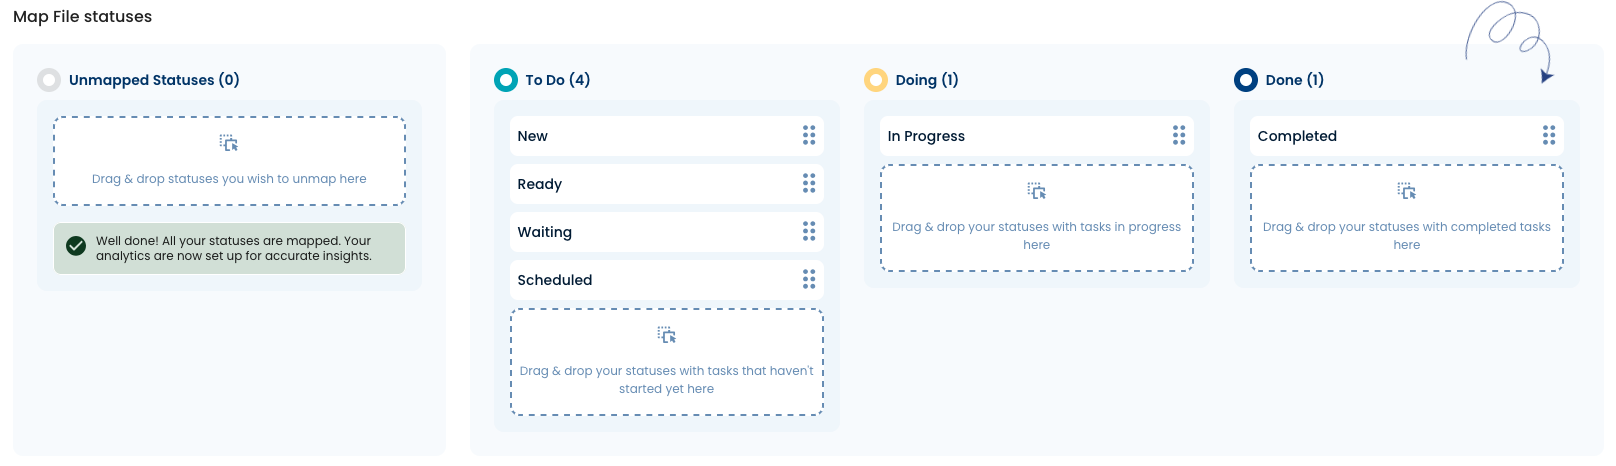
To Do: the work is waiting for a worker to start it
Doing: the work is being done, or is waiting for its worker to resume working on it
Done: the work is completeClick Create Dashboard. You are presented with dashboards showing one day's worth of data about the work on the board.

In TopLeft, enter the dashboard ID so TopLeft can send updated data every day. Get the ID from the URL of the dashboard page in Nave. In the example below, the ID is the bit starting with "690be9...".

Click Save to save the change. Return to Nave tomorrow and you should see new data in your dashboards!
Updated September 23, 2026